
Volume historyLoading crossing volume context
Preparing BTS-style measures, seasonal context, high-volume crossings, and citation guidance.
Preparing BTS-style measures, seasonal context, high-volume crossings, and citation guidance.
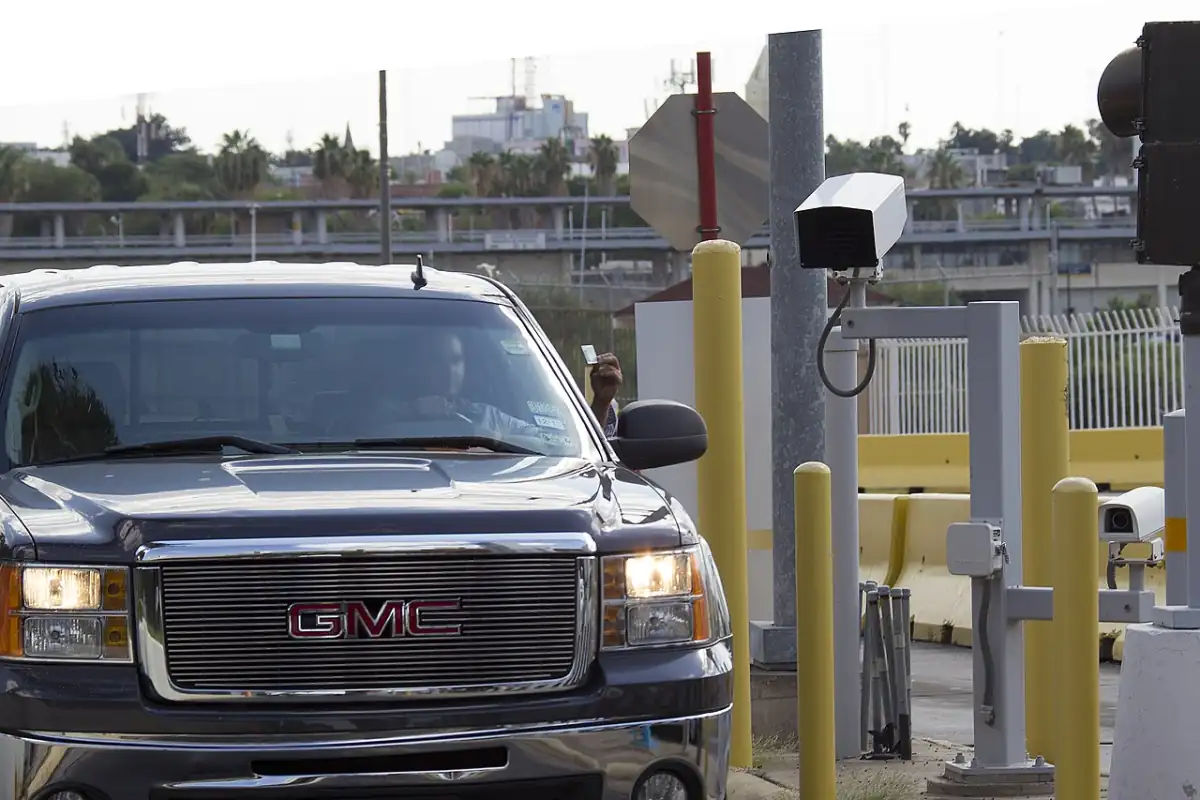
This page explains planned BTS coverage. Monthly volume is not available yet; use current waits for trip planning.
These pages show current waits. They are not monthly volume data.
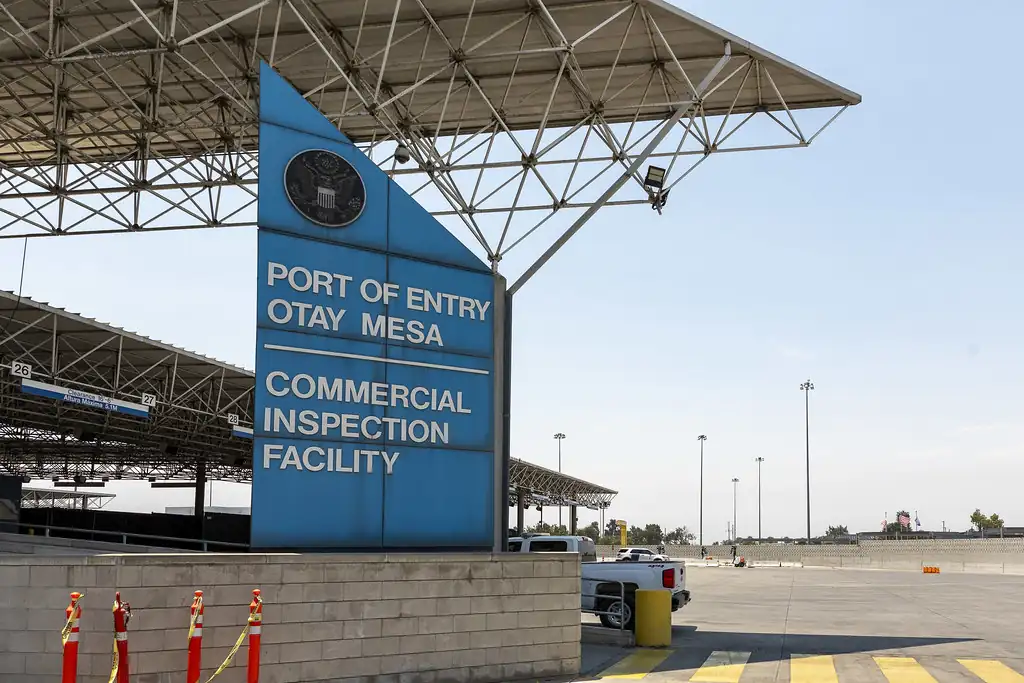
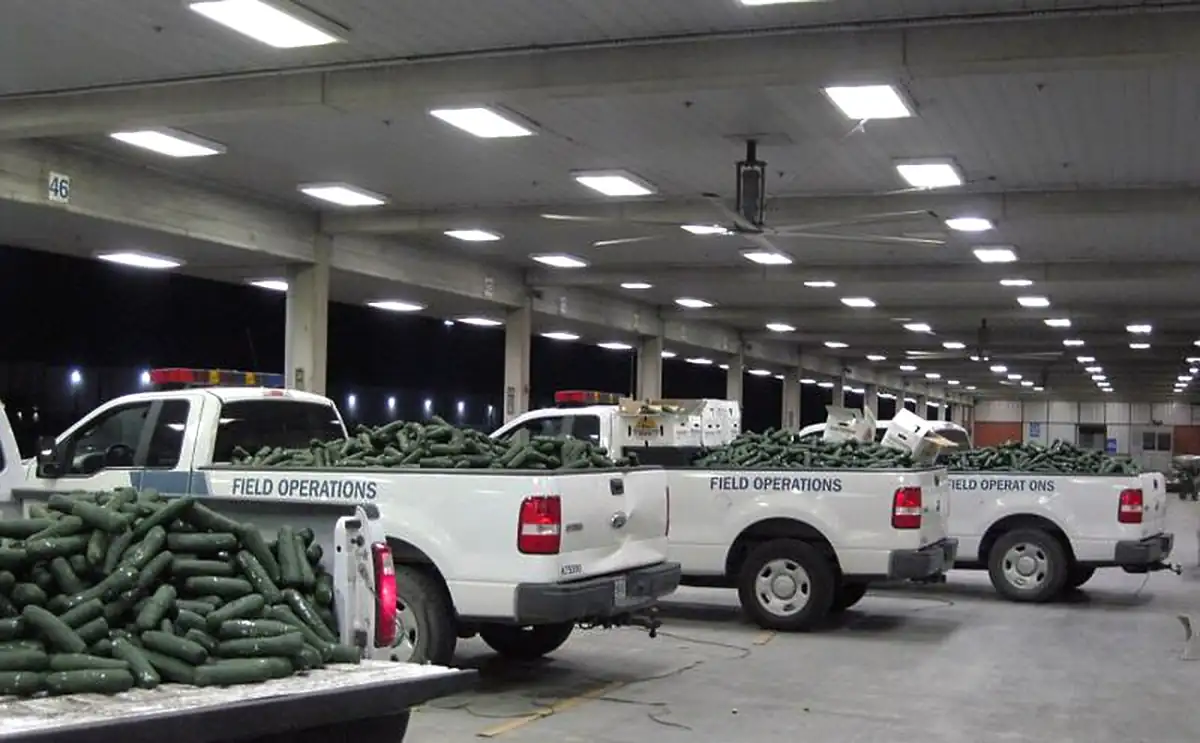
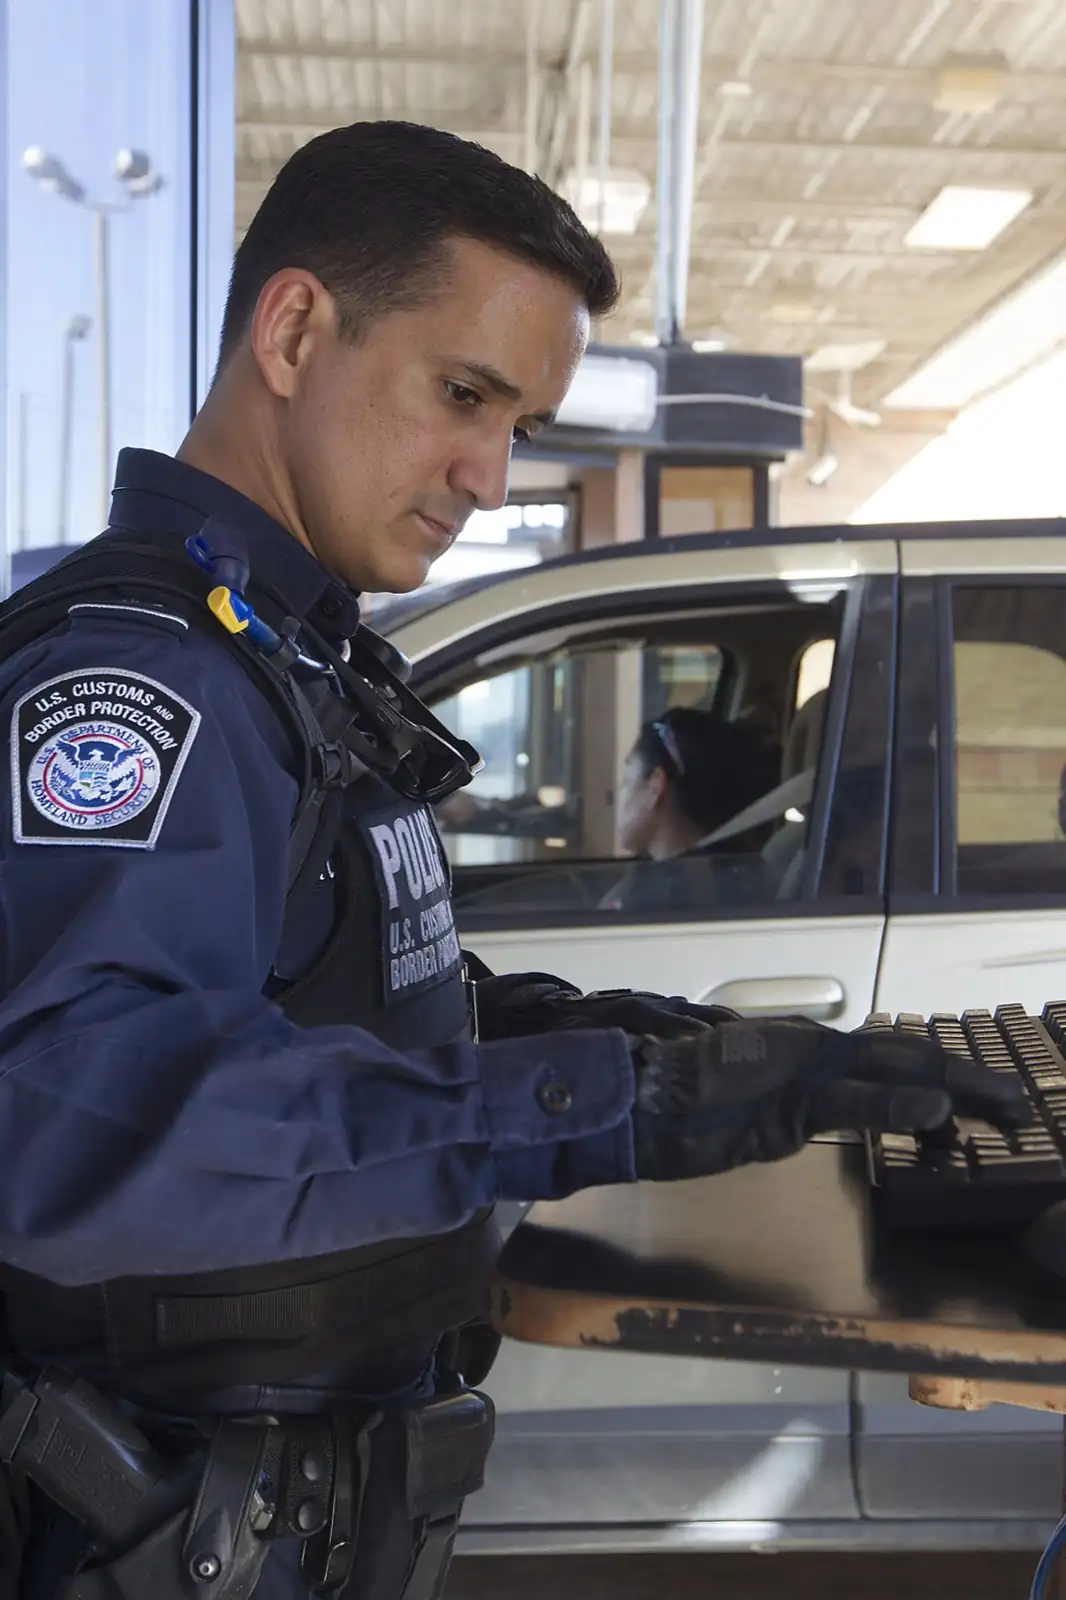

It helps explain seasons, freight demand, passenger vehicles, pedestrians, and regional pressure. It does not replace the current wait for a crossing.
Not always. Historical volume explains background patterns; departure decisions should use the current wait page, lane details, and update time.
Yes. The history widget shares waits by crossing and lane. That is separate from monthly BTS volume, which is not yet available on this page.
Cite the provider, exact measure, border, period, reference page, newest update, and any visible gaps.